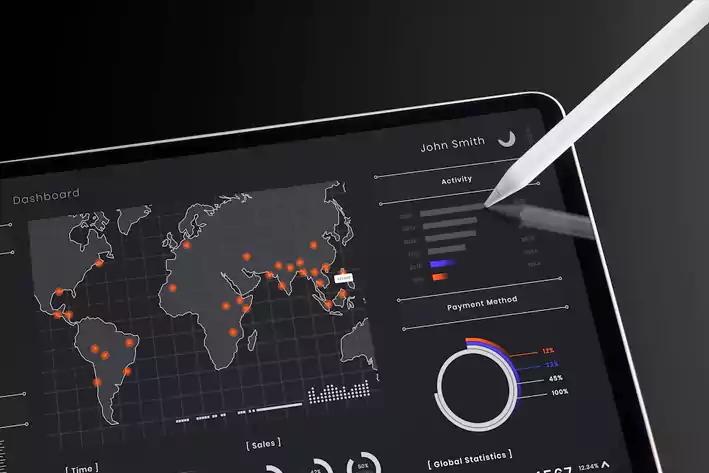
The Diploma in Data Science with a focus on Data Analysis and Visualization is tailored to equip learners with essential knowledge, skills, and tools in data analysis and visualization techniques. This course delves into various aspects of data analysis, including fundamental principles, statistical methods, data visualization techniques, and their applications in real-world scenarios.
COURSE OBJECTIVES
The course aims to provide students with a comprehensive understanding and appreciation of data analysis and visualization techniques and their significance in contemporary society. It encourages critical examination of data analysis methods and their impact on decision-making processes across various industries. Students will explore topics such as data manipulation, statistical analysis, visualization tools, storytelling with data, and emerging trends in data analytics.
COURSE OUTLINE
- Introduction to Data Analysis and Visualization
- Fundamentals of Data Manipulation and Cleaning
- Statistical Methods for Data Analysis
- Data Visualization Techniques
- Advanced Data Visualization Tools and Platforms
- Storytelling with Data
- Emerging Trends in Data Analysis and Visualization
STUDENT ACQUISITIONS
Upon completing the course, students will:
- Understand and appreciate the role of data analysis and visualization techniques in modern society.
- Develop a critical understanding of statistical methods and tools for data analysis.
- Evaluate data analysis techniques from various perspectives, including technical, ethical, and business considerations.
- Gain proficiency in using data visualization tools and platforms to create insightful visualizations.
- Apply storytelling techniques to effectively communicate insights derived from data analysis.
- Stay informed about emerging trends and advancements in data analysis and visualization techniques.
LEARNING METHODOLOGIES
The course employs a range of effective learning methodologies, including:
- Engaging with theoretical concepts to build foundational knowledge of data analysis and visualization.
- Encouraging independent exploration and analysis of datasets and statistical methods.
- Facilitating hands-on experience through practical exercises and data analysis projects.
- Promoting critical evaluation of research papers, case studies, and real-world datasets related to data analysis and visualization.
- Fostering logical thinking and problem-solving skills through data-driven decision-making exercises.
- Enhancing communication abilities for clear and effective presentation of data analysis findings and insights.


